MOF’s first inequality deep-dive since 2015 tracks who got richer, how wealth piled up, and why climbing the ladder is getting harder
The latest Singapore Occasional Paper on income growth, inequality and social mobility trends has been released by the Ministry of Finance (MOF) on Feb 9.
For the first time, the government is releasing data on wealth inequality, where administrative data taken from household surveys is used to derive estimates of wealth distribution in Singapore.
This is the second Occasional Paper to be published, coming after the first one that was released in Aug 2015.
Here are some of the highlights Vulcan Post found to be worth pondering upon.
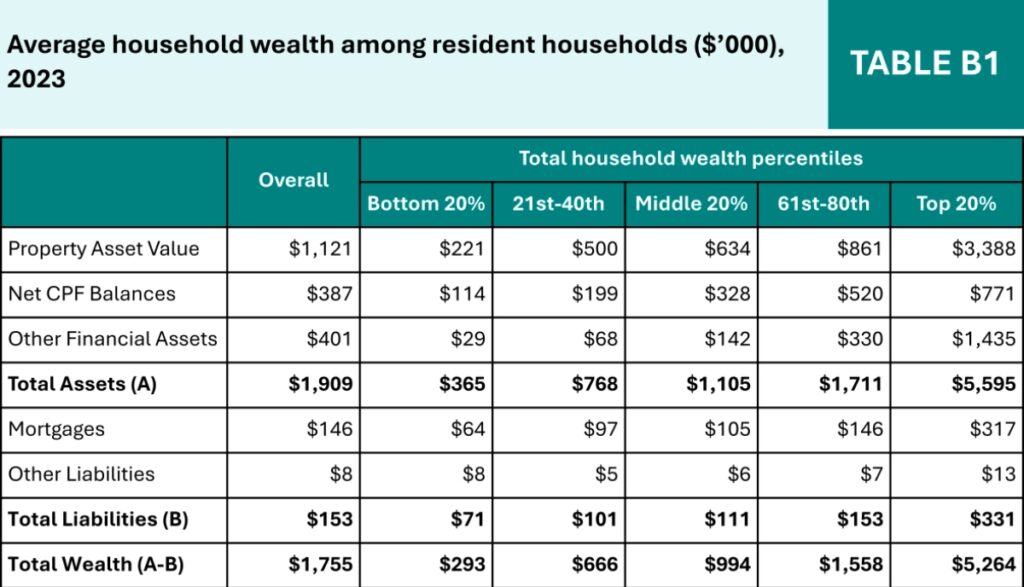
1. S’pore’s top 20% holds onto more average household wealth than 80% of the population combined

For instance, with the latest statistics from 2023, in total wealth, the paper reports that the top 20% holds an average household wealth of S$5,264,000, more than the combined average household wealth of the rest of the 80% at S$3,541,000 (after adding up the bottom four quintiles).
That’s a whopping 32.7% difference in average household wealth between the top 20% and the rest of the population.
Total wealth is calculated by taking the difference between total assets (property asset value, net CPF balances and other financial assets) and total liabilities (mortgages and other liabilities).
However, MOF notes that these numbers may be inaccurate, as “estimates may still be susceptible to under-reporting,” especially for higher net-worth individuals, who are “more likely to underestimate wealth”.
2. Singapore’s wealth inequality is ‘comparable’ to other advanced economies

Globally, wealth inequality tends to be higher than income inequality. Singapore is no exception, where its wealth Gini coefficient stands at 0.55 (vs 0.38 for income after taxes/transfers) in 2025.
Gini coefficient is a statistical measure of economic inequality, with a range of 0 (perfect equality) to 1 (maximum inequality), used to analyse income or wealth distribution.
Therefore, Singapore’s wealth inequality is comparable to other advanced economies like the UK, Japan and Germany, which range 0.6-0.74.
This is because of HDB and CPF policies, which act as key moderators of wealth inequality by supporting households, especially the lower income, to attain home ownership and accumulate retirement savings.
The report also revealed that most Singaporean households hold positive net wealth, unlike countries like the UK/Australia, where the bottom 20% have zero or negative home equity.
In Singapore, home equity constitutes over half of wealth, even for the bottom 20% of Singaporean households.
3. Social mobility remains strong, but shows early signs of moderation

Most Singaporeans have experienced upward income mobility across generations, and Singapore has done relatively well in sustaining social mobility compared to other advanced economies.
In addition, most Singaporeans earn more than their parents in real terms, consistent across birth cohorts.
Relative mobility is competitive internationally: Children born to the bottom-20% fathers have better odds of earning higher incomes in adulthood, with 13.8% of whom become top-20% earners, compared to the US, UK or Australia.
However, as Singapore’s economy matures, MOF said that sustaining mobility across generations will be more difficult, as our social mobility has shown signs of gradual moderation.
The correlation between parent and child incomes has increased modestly over time, and the share of poor children remaining in bottom 20% has risen—early signs of slowing mobility similar to patterns in other advanced economies.
4. Singapore’s tax and transfer system is highly progressive

Singapore’s tax and transfer system is benefiting our lower-income families as it should.
The Government redistributes resources to support those with greater needs, while keeping the tax low for lower-and middle-income households.
Lower-income households receive far more in benefits than they pay in taxes, whether measured by market or employment income.
For every S$1 in taxes paid, bottom 20% households receive approximately S$7 in benefits, while the top 20% receive about S$0.20.
This benefit-to-tax ratio is more favourable to lower-income households than in Finland or the UK.
Approximately 35% of Singapore workers pay no personal income tax, while the top 10% of earners pay about 75% of all income tax.
The system keeps the overall tax burden low for the broad middle while targeting support to those who need it most, ensuring that economic benefits are shared equitably across all segments of society, said the Government.
- Read other articles we’ve written on Singapore’s job landscape here.
- Read more stories we’ve written on Singaporean businesses here.
Featured Image Credit: Andrzej Rostek via Shutterstock